Can You Hear Me Now? 4 Telecom Dashboard Examples for Monitoring Network Performance

For telecom providers, maintaining a high quality of experience is critical in minimizing the risk of customer churn in saturated markets. And while the commercials will lead you to believe that range of coverage offered is the number one concern for potential buyers, the full experience – from data and voice coverage to customer service response times – is what really keeps customers happy.
In order to quickly mitigate any network performance issues, network operators need to monitor service assurance, as well as analyze detailed visualizations of the quality of customer experience and the underlying quality of network performance. Here are just a few dashboard examples that can be embedded within customer service applications to help network operators ensure they are keeping networks running and customers happy.
Meet Logi Composer
Download NowNetwork Performance
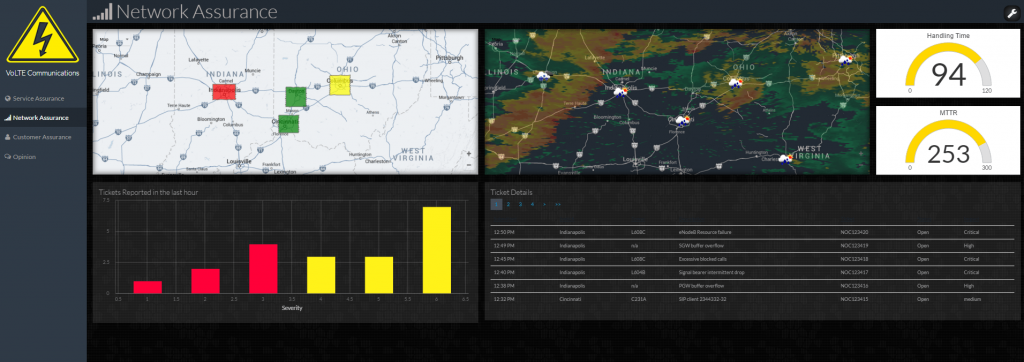
It’s important to have a clear dashboard that will allow users to monitor networks to quickly identify problems and outages, and improve meantime to repair.
Dashboards are provided to monitor Quality of Experience (QoE) metrics in near-real time for offered services. These dashboards offer a high-level view of QoE status levels by market using geomaps. The color of the market coverage reflects the deviation from established thresholds for the various service offerings.
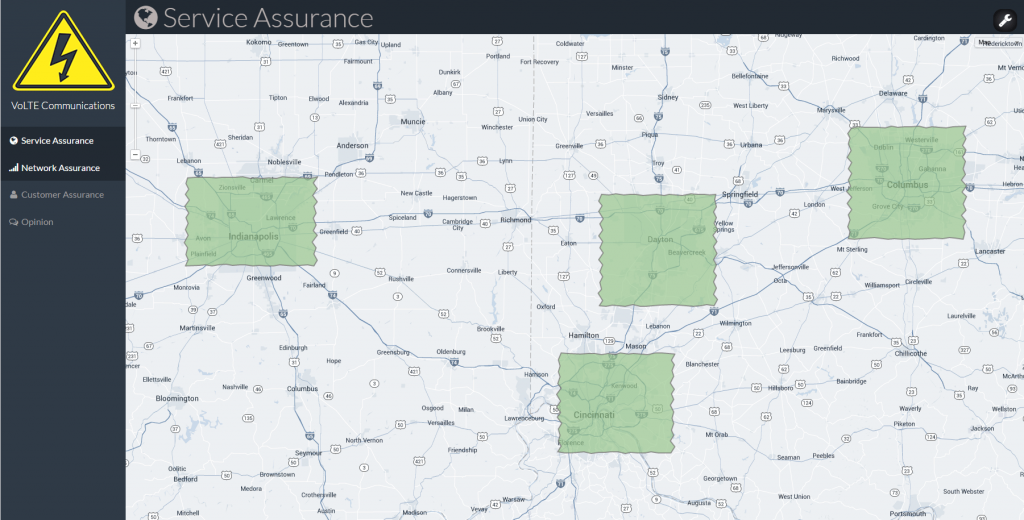
Each market area includes drill down option to view the underlying QoE metrics for supported services. Performance status is also color-coded.
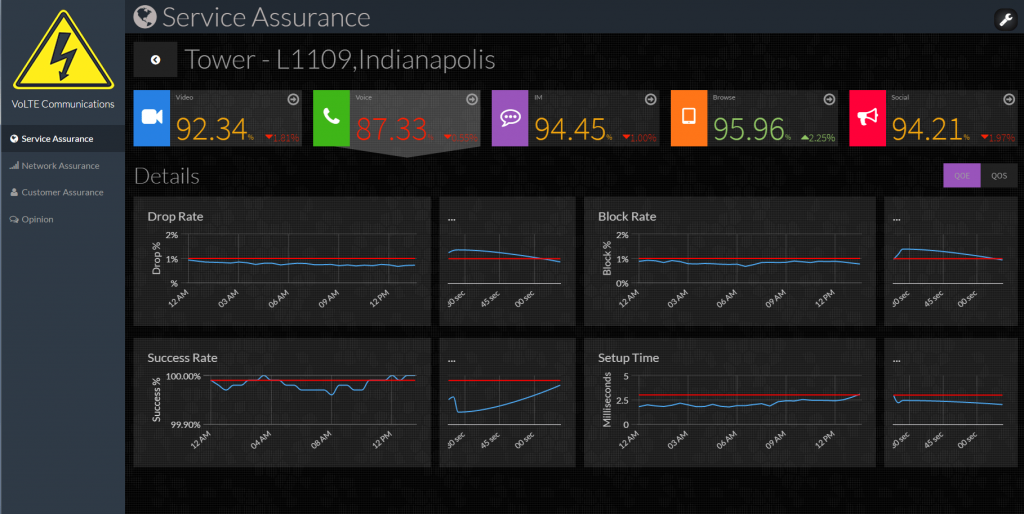
The details behind the service-level performance indicators can be viewed. QoE metrics, such as a blocked or dropped call for voice services, as well as the correlated Quality of Service values can be plotted over time. The rate of change can reveal emerging trends. The plots are compared to average and threshold levels for the appropriate metric.
Customer Satisfaction
Quickly resolving issues is one way to keep customers happy. By analyzing customer support tickets and wait times, providers can optimize call centers and help desk operations to increase average revenue per user.
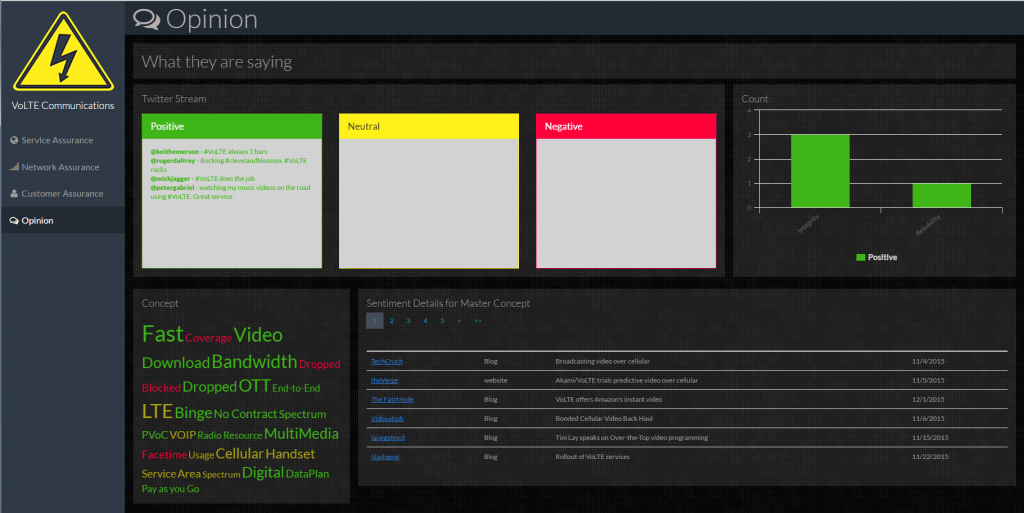
Since customer satisfaction is measured by meeting the necessary performance characteristics to achieve the desired experience, it can also be valuable to monitor what is being said on social media. Published media, including blogs and news sources, are mined for developing concepts and their sentiment. Twitter feeds are monitored to see what is being said out in the market.
By monitoring service performance from a customer’s experience perspective, telecom providers can rapidly react to emerging network issues thereby reducing the likelihood of churn.