4 Steps to Good Dashboard Design

Good dashboard design is a common goal for development teams. If an application doesn’t look great, it won’t get used. This applies to any application but is especially true when it comes to the embedded dashboards, reports, and analytics in your software. Developers—not designers or UI/UX experts—are usually the ones tasked with creating dashboards and reports. Fortunately, it doesn’t take an expert designer to create effective analytic applications.
Whether your application’s embedded dashboards and reports are due for a refresh or you’re just getting started, here are some best practices to follow:
#1. Know Your User When Designing a Dashboard
Understanding your user and how they will use your dashboard is a good first step. Your team can gain important context from understanding what is important to your users, what data means to them, and how data will shape their decisions. As a content author, you may be tempted (or sometimes forced) to make assumptions based on datasets, which results in visualization driving the end-user experience. Rather than designing based on what fits in a visual, try asking a few key questions first:
- What information does your user need to display?
- What are your users interested in?
- What are their pain points?
- What are their goals?
If you ask these questions first, you can produce content that reflects your users’ answers, leading to a better overall dashboard experience.
#2. Summarize, Don’t Include All the Details
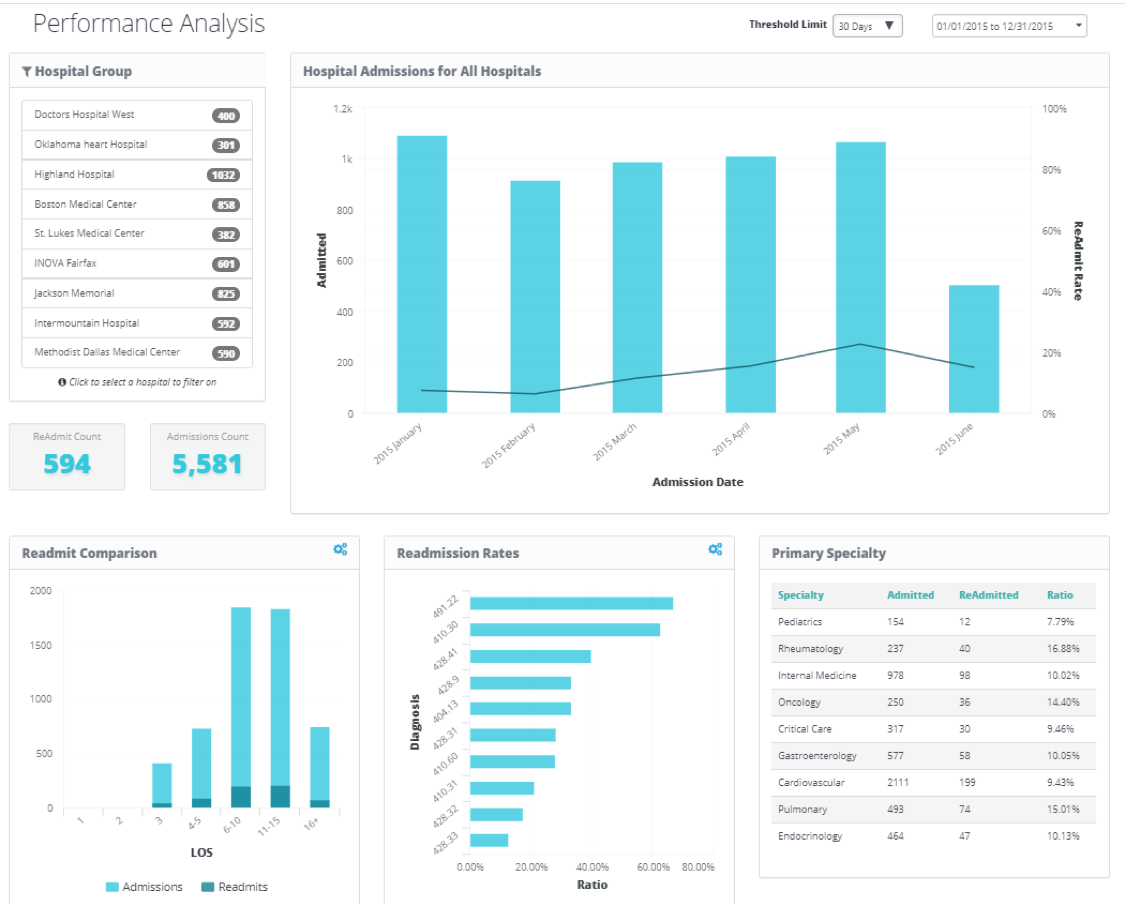
The more details you have in your dashboard, the more cluttered your dashboard becomes. Every piece of information doesn’t need to appear on your dashboard all at once. Shoving all of the information you have available into a dashboard just isn’t a good solution for you or your users (but some people try it anyway). You’ll be much better off if you think critically about your content (i.e., what is actually important). Careful consideration of what needs to be included or not helps you ensure that your dashboards are effective and easy to use.
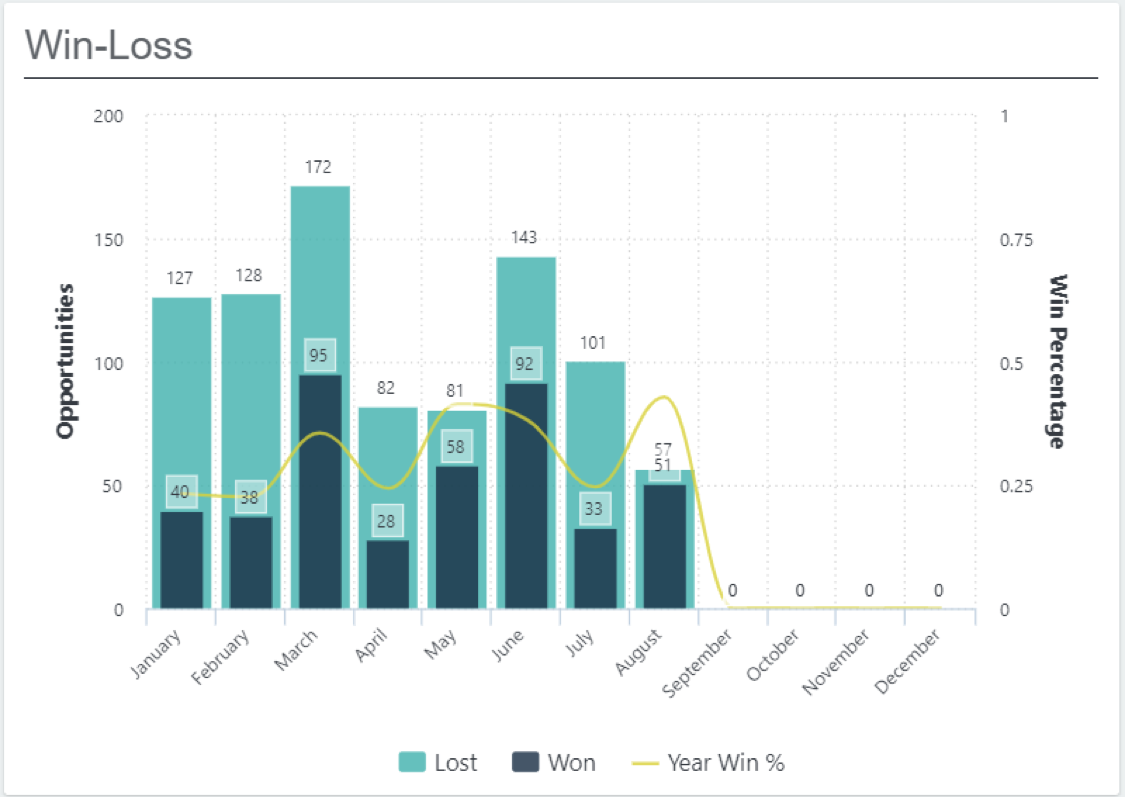
Which visuals you choose can make a big difference in user experience, so choose those wisely as well. If you’re summarizing information, you’re best off using a chart. Tables—while potentially popular with your dev team—are best used for displaying details.
#3. Keep Your Dashboard Simple and Clean
In addition to summarizing information, you’ll want to keep your dashboards simple and easy to use more generally. I’ll say it again—just because you have loads of information you could provide doesn’t mean all of that information belongs in your dashboard. If you need a few inspirational quotes to help support your quest for simplicity, here are some of my favorites:
- KISS – Keep It Simple, Stupid. Less is more; a clean design is a good design.
- The Incredibles’ Syndrome says, “If everything is important, then nothing is.”
- The Paradox of Choice by Kevin Schwartz: The more options you provide, the more complex the decision making process is.
And if someone on your team says the phrase, “Someone may be interested,” then it’s time to put on the brakes. If you stick with information that’s useful and meaningful, you’ll be supporting your end users and their goals. Everything else runs the risk of being visual noise and confusing your users.
#4. Is Your Dashboard Still Cluttered? Drill Down to Details
If you’ve kept things simple, kept your users in mind, and still have a dashboard that looks cluttered, look for a higher level summary, then drill down to more detailed information. While this practice does move your additional data one more click away, that extra click buys you more real estate and the opportunity to provide greater focus.
Good design means guiding your users to what is interesting and relevant to their immediate needs—and that can make all the difference.
Key Takeaways
- Understanding your users and how they will use your dashboard is important.
- More is not always better when it comes to dashboard design.
- Clean design is good design.
- Use charts for summaries and leave details to tables.
- Reduce design clutter by looking for a higher-level summary, then narrow down to more detailed information.

The Definitive Guide to Dashboard Design
Download Now: