Embedded Analytics Solutions for Your Applications
Learn how Logi Symphony can augment your applications to help with your embedded reporting needs.
"*" indicates required fields
Capabilities
Give your users insights to their data without burdening your development team
Suppose you are a product manager responsible for an application that empowers users to make data-driven decisions. In that case, you know how challenging it can be to meet. You must deal with multiple data sources, complex analytics tools, manual data preparation, and more.
You need a solution that can automate and accelerate your analytics process while ensuring ease of use, robust integration capabilities, and powerful data visualizations. You need a solution that can handle any type of data scenario, from simple to complex, and provide users with real-time visibility into their data.
Use Cases
Unlock the Power of
Embedded Analytics
Discover how embedded analytics can enhance the reporting capabilities of your product offering with these common use cases and features. Embedded analytics is industry agnostic and can be used by anyone with a need to visualize data.
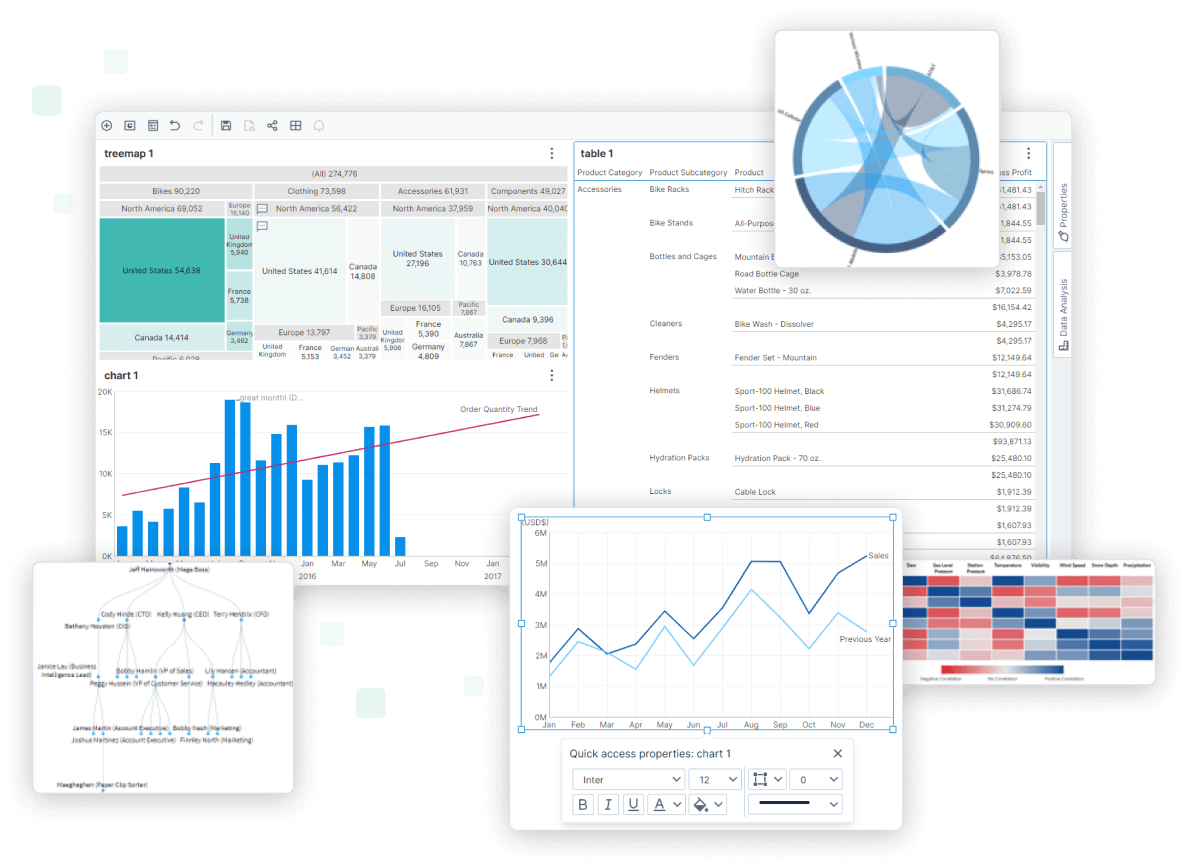
Managed Dashboards: Create dashboards that meet your precise needs and empower non-technical users to explore and discover data with ease.
Modern Data Discovery: Empower data-minded users to create their own content, slice-and-dice data, and filter to find custom insights with our modern data discovery tools.
Pixel Perfect Reporting: Create and embed long-form, detailed, and pixel-perfect reports within your applications or set up automated reporting systems for your business.
Embedded Contextually Aware Content: Deliver contextually appropriate information to end users at the point of decision within your application with our embedded contextually aware content.
Security: Ensure user-based security and curated content based on the user or corporation viewing the data with our embedded BI security features.
White Labelling and Branding: Customize the look and feel of your analytics to match your branding and even morph it based on your clients’ logos and colors with our white labelling and branding options.
API and Plugins Our API and plugins are crucial to the long-term success of your embedded application, allowing for greater functionality and flexibility.
iFrame-less Embedding: Performance matters. Embed content tightly and in a low overhead manner with our iframe-less embedding abilities.
Hosting: Embedded analytics can live anywhere you host your application, whether you need it in the cloud or on-premises with Windows and Linux – or using container orchestration like Docker.
Scalability: Elastically scale with cloud-ready microservices and load-balancing support to ensure your analytics can grow with your business.
Multi-tenant: Segment your users into separate tenants creating a SaaS-based setup resulting in additional security.
Fault Tolerance: Create active or passive failover to ensure your users can always access their data, even in the event of an outage.
Data Governance
Simplify data for self-service use by your users and help ensure proper structure for an easy user experience.
Data Modeling
Join, blend, cleanse, and augment data without a specialized data engineer with our data modeling tools.
Data Performance
Accelerate data for your embedded analytics via build data warehousing and our patented in-memory data engine to ensure fast performance.
Embedded Database
Unlock the full potential of your application with an embedded database system, tightly integrated and seamlessly working alongside your software.
Predictive Analytics
Harness analytics to predict data outcomes which enable users to reach the full potential of their data.
AI and Machine Learning
Analyze patterns and trends not immediately apparent to humans with our AI and machine learning tools.
Natural Language Generation
Allow users to generate data visualizations based on everyday speech with our natural language generation feature.


Roles & Industries
Making use of Embedded Analytics
An embedded analytics platform is used in various roles across the business function to provide:

Product Manager
Product Managers aim to integrate analytics into their applications, offering end users enhanced features, boosting revenue, and maintaining a competitive edge. They seek stable partnerships with companies providing Data Visualization, Predictive Analytics, and Data expertise to mitigate risks. Additionally, they aim to reduce expenses by equipping internal development teams with efficient tools for content delivery and self-service content creation, saving valuable time.

BI Manager/ Implementer
BI Managers seek to provide their end users with insightful and actionable content through dashboards and reports. They require tools for their teams to help build the requested content and deliver an exceptional experience while balancing the time commitment to do the work.

Application Developers
Application Developers play a crucial role in bridging the gap between embedded analytics software and their respective applications. With a keen focus on integration, these developers ensure a seamless and efficient connection between the two, enabling users to access and utilize powerful analytics capabilities within the context of their applications.

Customer
Integrating embedded analytics into your application provides your customers with better data-driven decision-making, improved efficiency, self-service discovery, personalized insights, and enhanced collaboration. This makes your application more valuable, increases user engagement, and fosters customer satisfaction, leading to increased loyalty and differentiation from competitors.

Sales Analytics
Sales teams need real-time insights into their performance so they can make informed decisions about how to improve.

Marketing Analytics
Marketing teams can data visualization to identify trends and patterns in customer behavior, which can help them develop more effective marketing strategies.

Financial Analytics
Financial teams can use BI and Analytics to help them identify areas where they can reduce costs, increase revenue, and shape future strategies.

Healthcare Analytics
The healthcare industry employs business intelligence and analytics for patient data analysis, clinical research, operational efficiency, resource allocation, and improving patient outcomes.

Manufacturing Analytics
Manufacturers use business intelligence and analytics to optimize supply chain management, improve production efficiency, track quality control, predict maintenance needs, and optimize resource allocation.

Retail and E-commerce Analytics
Retailers leverage business intelligence and analytics to analyze customer buying patterns, optimize pricing and promotions, manage inventory, personalize marketing campaigns, and improve overall customer experience.

Transportation and Logistics Analytics
Businesses in this sector employ analytics for route optimization, demand forecasting, supply chain visibility, fleet management, and operational efficiency.

Energy and Utilities Analytics
The energy sector uses business intelligence and analytics to monitor energy consumption, analyze equipment performance, optimize energy distribution, predict maintenance needs, and identify cost-saving opportunities.
Webinars & Resources
Take a look at our resources and webinars packed with handy tips, best practices and insights, brought to you by insightsoftware’s product and solutions experts.


10 Advanced Data Visualizations with Logi Symphony

FAQs
Embedded analytics is more than just adding charts and graphs to your application. It’s a way of embedding data-driven features such as interactive dashboards, pixel-perfect reports, self-service data discovery, and more into your existing application. This way, you can provide your users with a seamless and engaging data experience that complements your core application functionality.
Unlike traditional business intelligence (BI) tools, embedded analytics platforms are designed to integrate easily with your application, offer high levels of customization and extensibility options, and enable self-service analysis for your users. With embedded analytics, you can turn your application into a data powerhouse that delivers extra value to your users.
Embedded Analytics Tools can integrate with a large variety of data sources. As a rule of thumb, if the source data is open, a robust embedded analytic tool can connect to it. These data sources can include:
- Relational databases example: MySQL, Oracle, SQL Server, PostgreSQL
- Data warehouses example: Amazon Redshift, Google BigQuery, or Snowflake
- CRM or Business Applications (API) example: Salesforce, Microsoft Dynamics, SAP</li
- Cloud-based data sources example: Amazon RDS, Google Cloud SQL
- Flat files example: Excel, CSV, DBF
The ultimate user experience of the embedded analytics you offer your end users depends on your vision for the offering. From its simplest form of incorporating a handful of data visualizations into your application to its most profound implementation of seamless integration and a truly comprehensive experience, the possibilities for embedded analytics are boundless.
To see a live example of an embedded analytics experience, check out our Wine Cellar Demo (Click SIGN IN) or our Logi Symphony Gallery to see samples of embeddable dashboards and reports.
The technical experience needed to have Embedded Analytics depends on your goals and the level of integration desired.
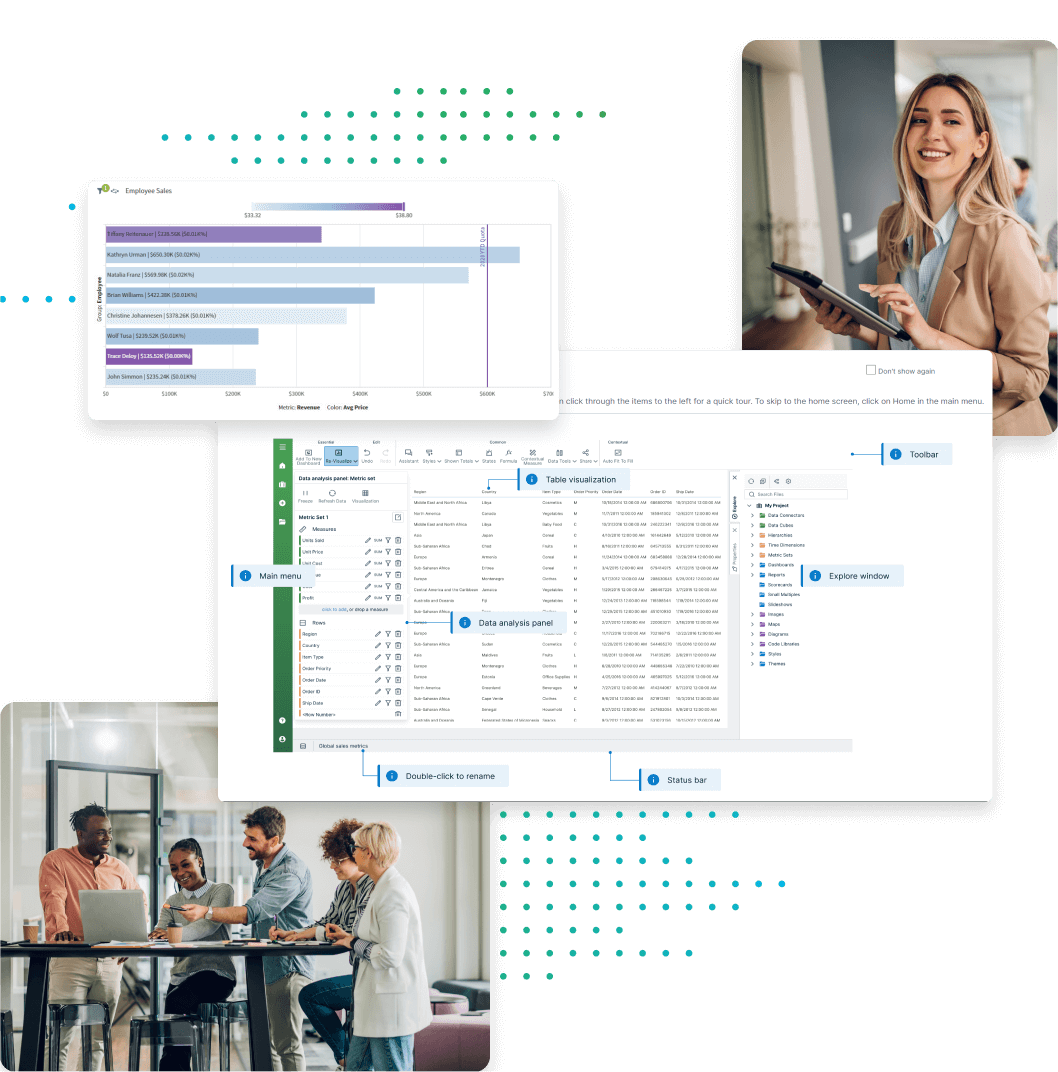
Users viewing, interacting, filtering, drilling down, or building their own self-service content need not be technical. An embedded analytics tool like Logi Symphony provides an easy-to-use experience directly within your applications.
Technical requirements are required for the DevOps teams to perform the initial integration; however, the actual embedding of the content does not require users to write code.
Embedded Analytics Platforms are industry agnostic, and the functionality provided applies to all general use cases. Industry-specific tools do exist but are typically a white-labeled version of a generic business intelligence and analytics tool with pre-built content included.